
 CalcBuilder example
Break-even Analysis
September 21, 2026

Live result on the frontend
The Break-even Analysis calculator shows the sales volume at which a product stops losing money, how much room the business has above that point and how revenue and cost compare on either side of it.
What it calculates
A visitor enters monthly fixed costs, the variable cost and price of one unit and the units they expect to sell. The calculator returns:
- Break-even units and revenue — fixed costs divided by the contribution margin, shown as a whole number of units (rounded up) and as the matching revenue.
- Contribution margin — price minus variable cost, in dollars per unit and as a percentage of the price.
- Margin of safety — how far expected sales can drop, in units, revenue and percent, before profit reaches zero.
- Expected monthly profit — expected units times the unit margin, minus fixed costs; shown as a loss when negative.
- Revenue versus cost chart — paired bars at 0 to 2 times the break-even volume, with costs split into fixed and variable, and a safety gauge with a pin on the expected sales.
How it’s built
Four Number fields feed the PHP Code, which validates the margin (no break-even exists if the price does not exceed the variable cost) and builds every visual as plain HTML: nine bar pairs sized in percent, and a red/green gauge whose split point and pin are computed in PHP.
The PHP returns finished HTML strings (##chart## and ##safety##) that the Exit Layout drops in, next to display strings for the hero and metric cards. The default values give a break-even of 334 units and a $5,280 monthly profit.
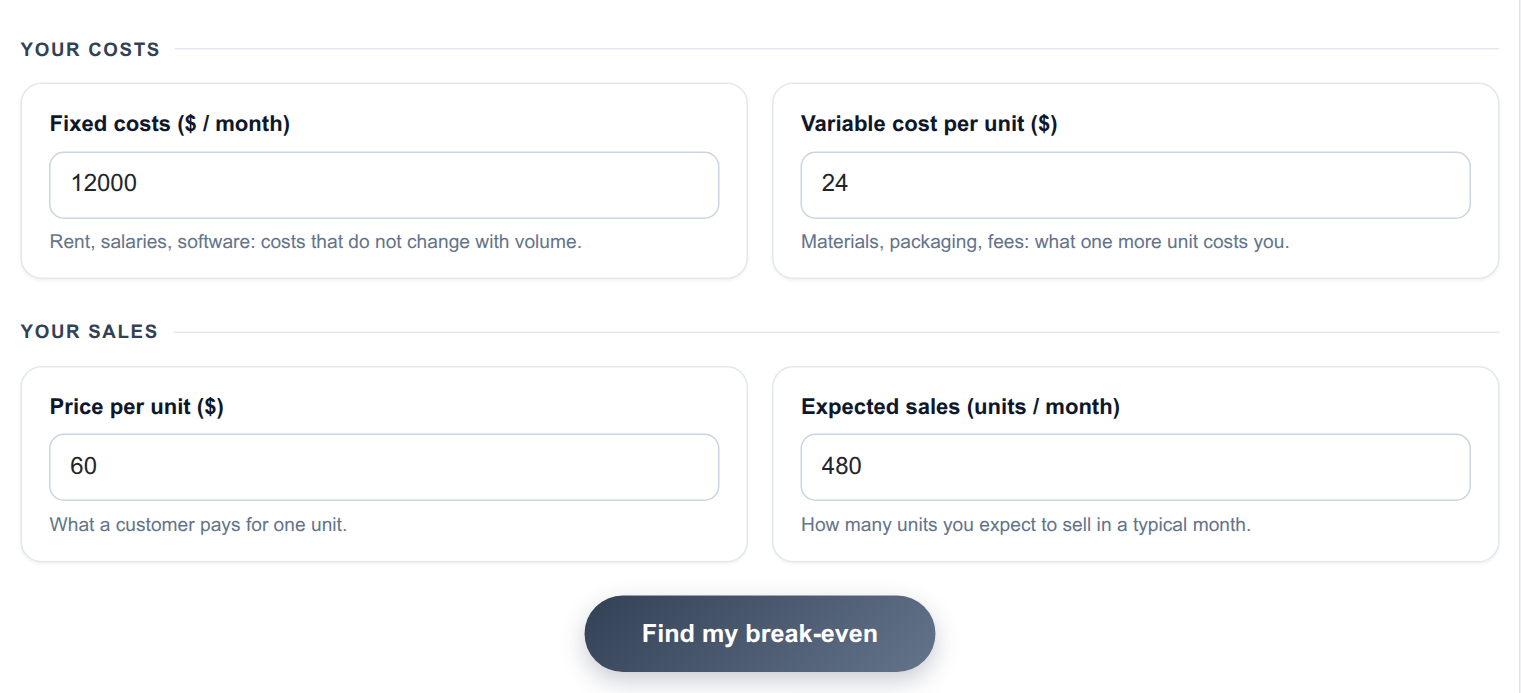
The input form as your visitors see it, styled with the Form Layout.
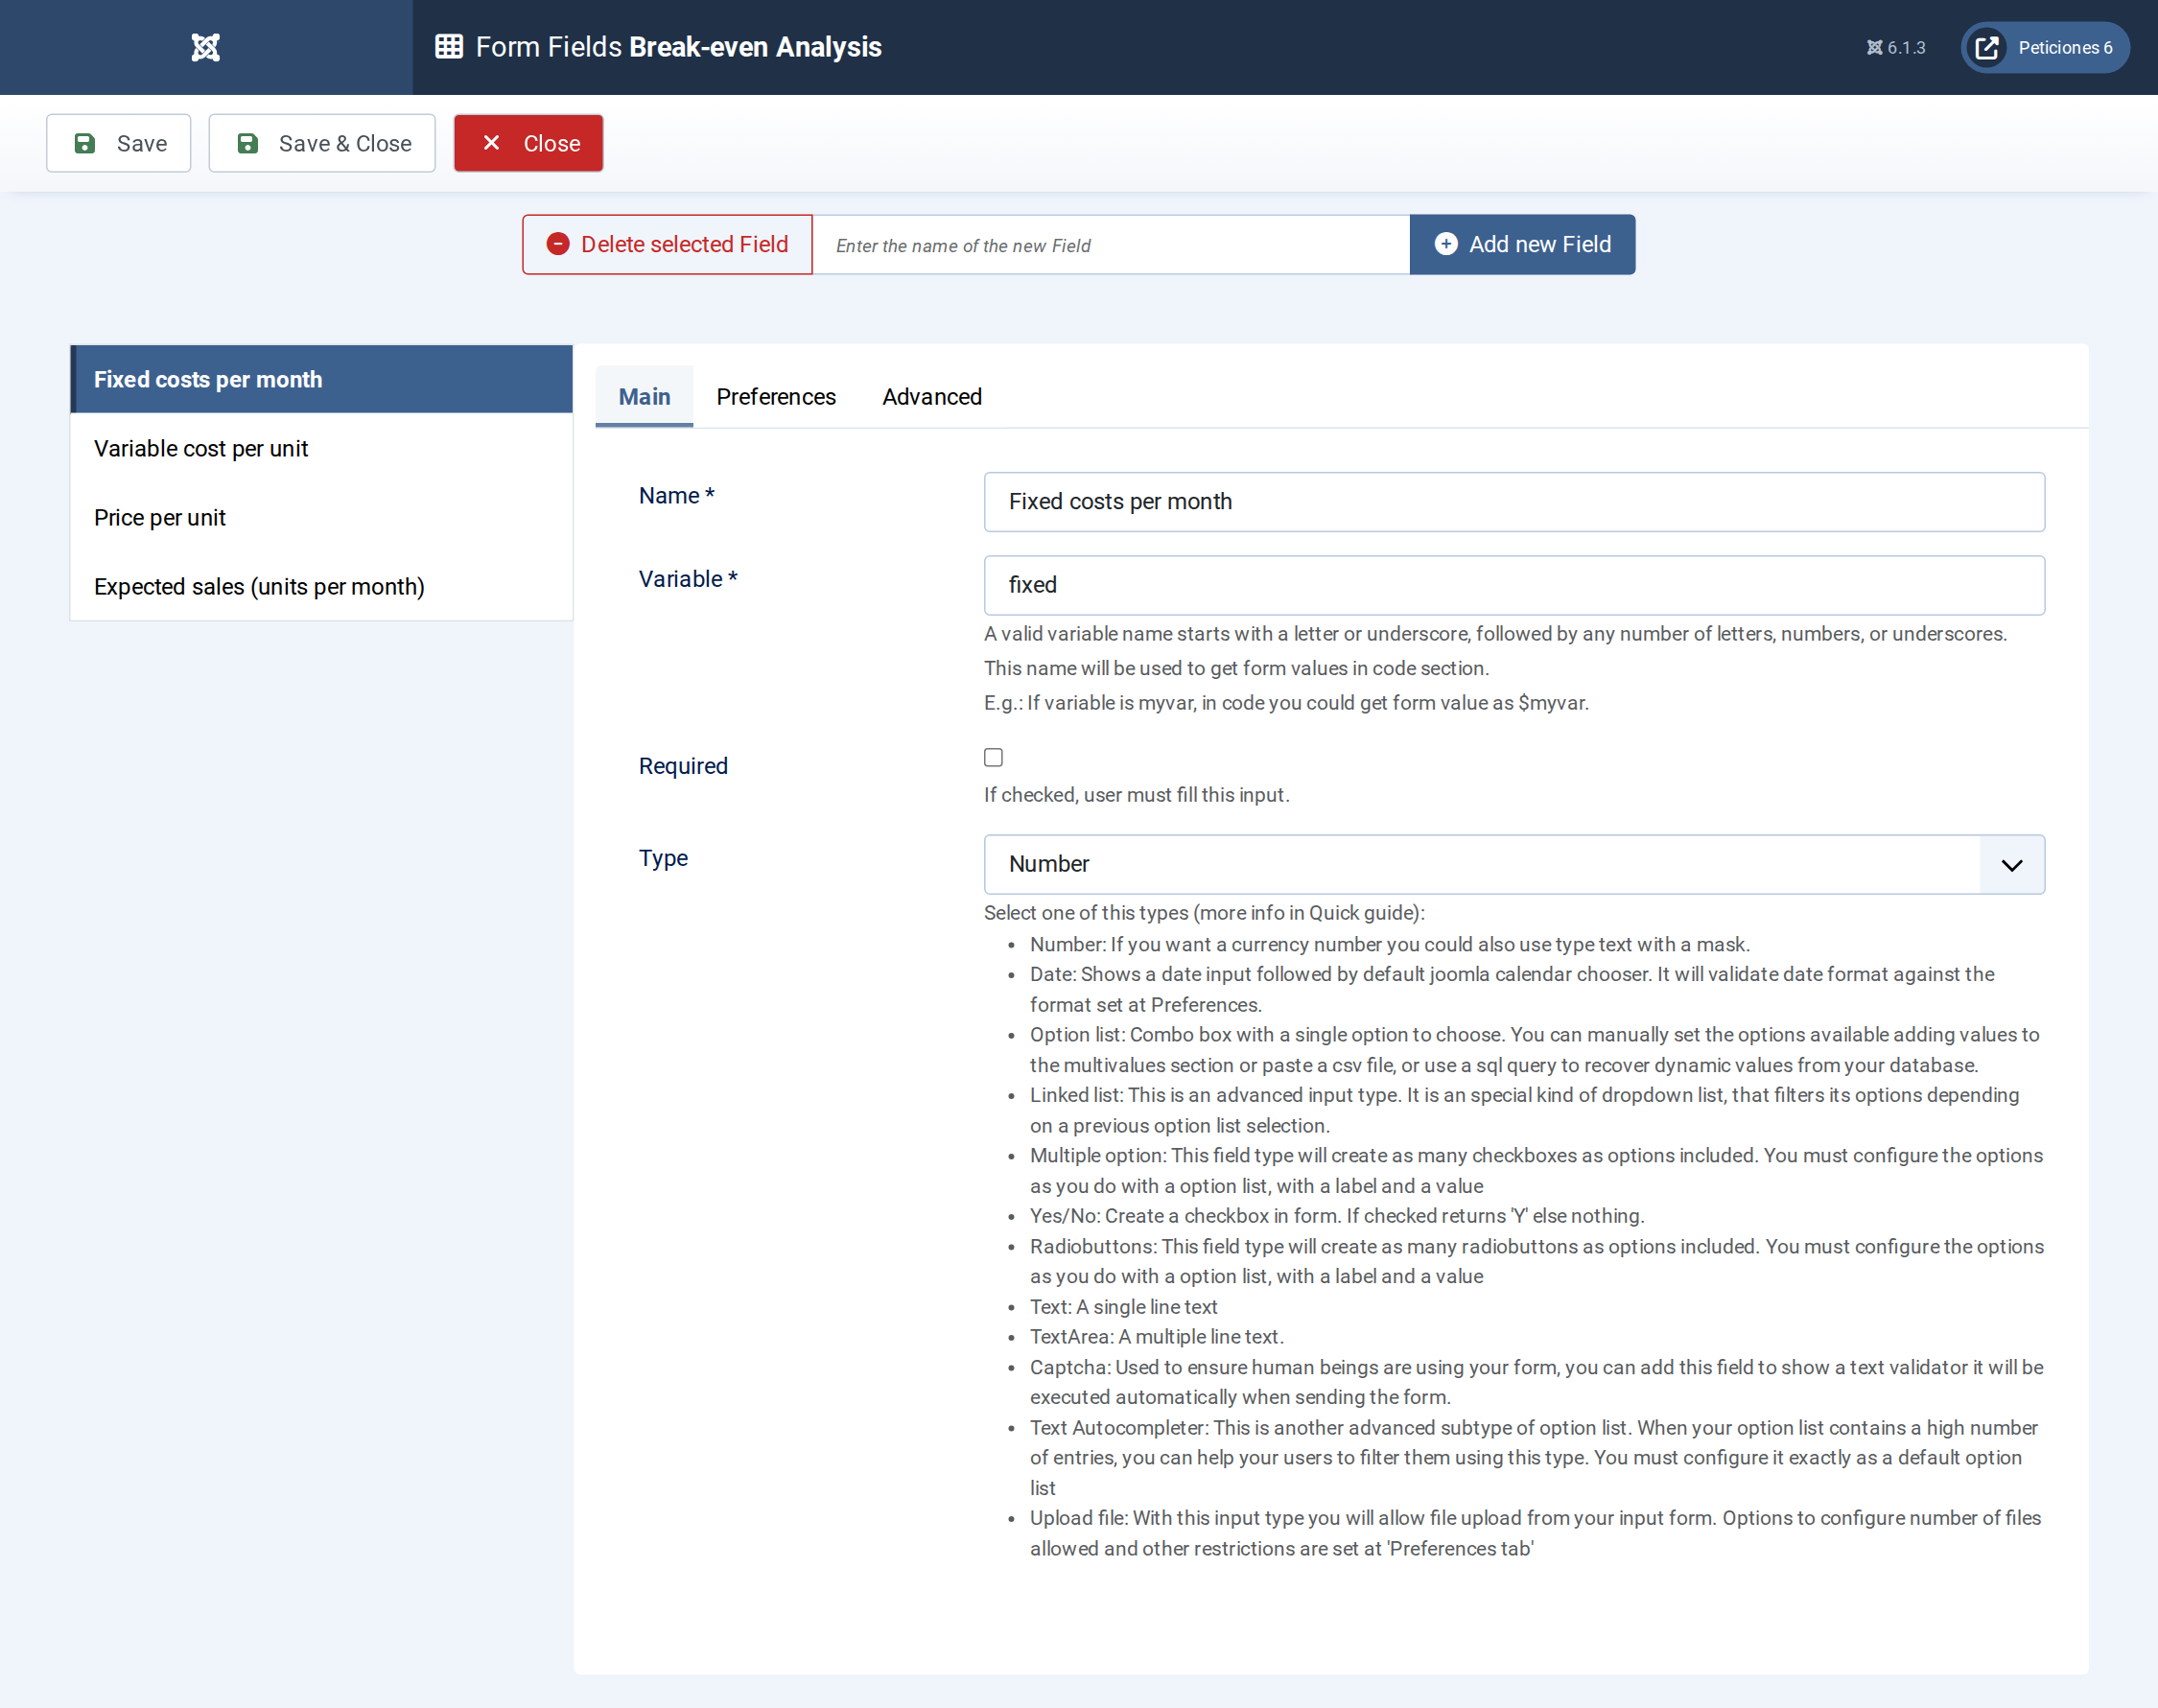
Four Number fields: fixed costs, variable cost, price and expected units.
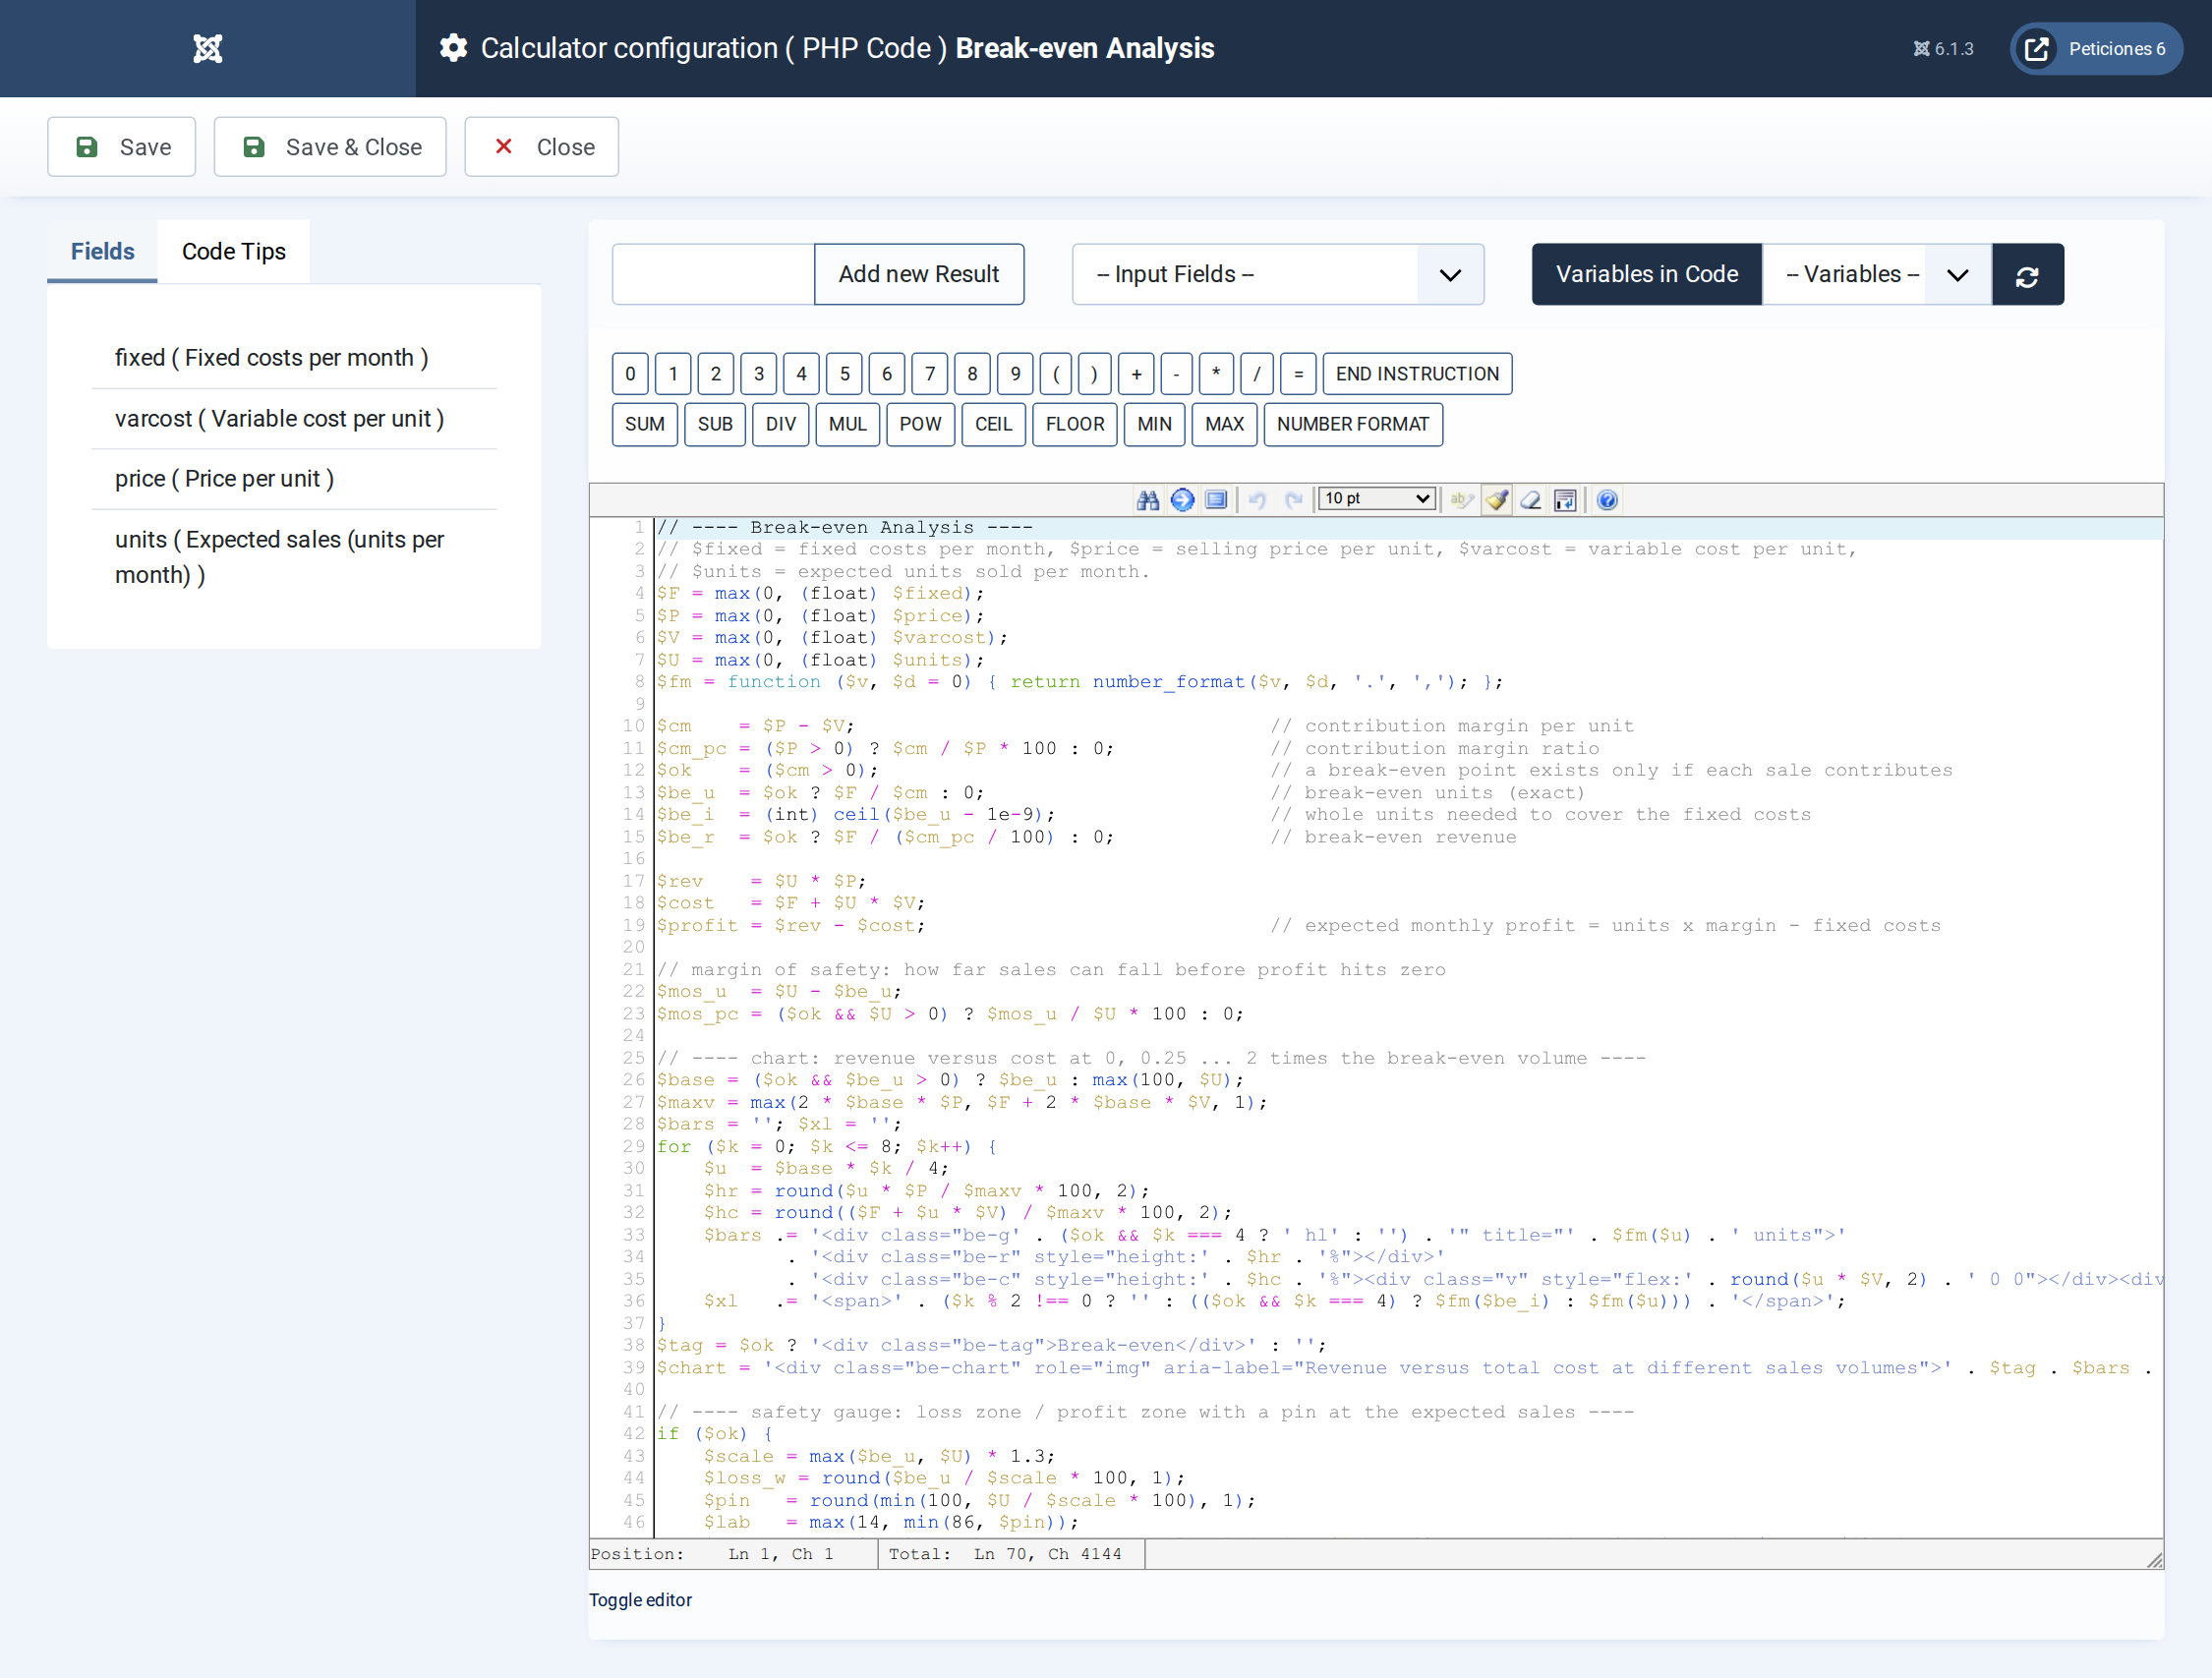
Contribution margin, break-even, margin of safety and the chart and gauge markup.
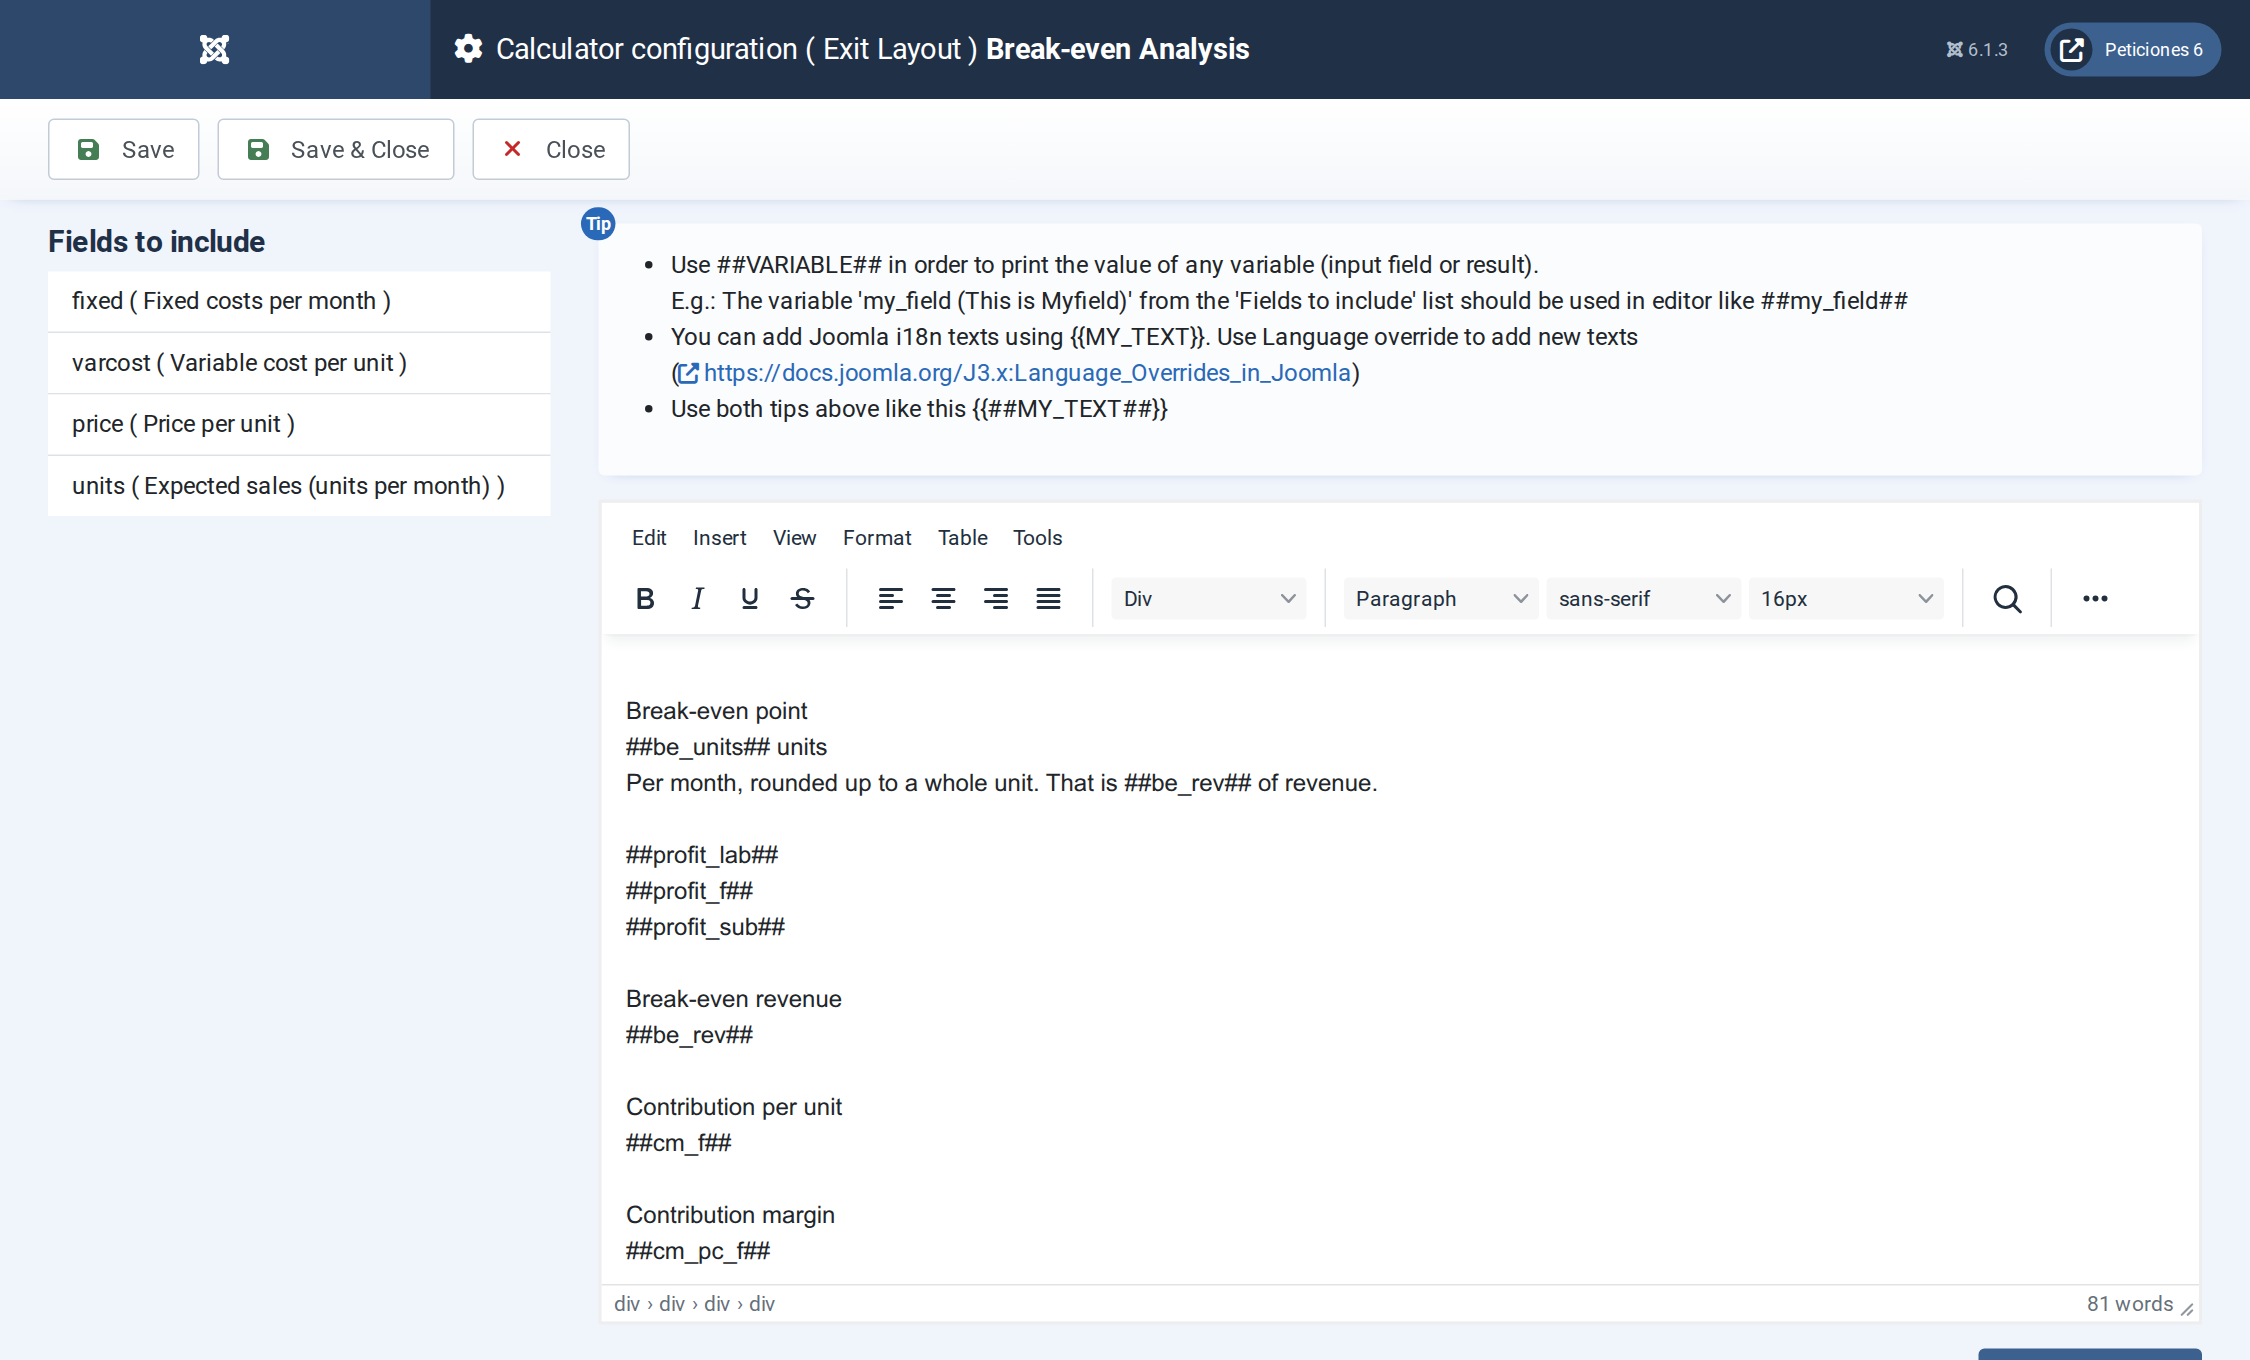
The Exit Layout: two hero cards, four metric cards, the chart panel and the safety gauge.
Want this exact example on your own site?
Download the file above, then in your Joomla admin open Components › CalcBuilder › Import and upload it — it's the same file you'd get from that component's own Export button, so it drops in as a ready-to-use, fully working copy in one step.